
Oceans cover 70% of the Earth's surface. Nevertheless, even today, the in situ bathymetric measurements of the seabed only represent 10% of the entire marine area. In 1995, thanks to the GEOSAT and ERS-1 satellites, the space altimetry became necessary to obtain a global and regular mapping of the seabed.
The water film formed by the oceans hides the seabed topography so planets such as Venus or Mars are better mapped than our planet. However, the seabed topography is a basic data for a lot of scientific fields such as the oceanic lithosphere study and Earth's plate tectonics, the oceanography, marine biology and global environment.
It also presents economical and political interests such as Law of the seas and delimitation of the Exclusive Economic Zones or the marine, living and/or mineral resource assessments.
Not only the current surface covered by in situ bathymetric surveys represents just around 10% of the entire seabed, but many of those surveys are of dubious quality. The Smith's review (1993) assessed that only 5% of those oceanographic expeditions benefited from an accurate GPS positioning and multibeam sounders. McNutt (1996) estimated that 5 billion dollars would be necessary over a century to get a complete coverage of the seabed. The space altimetry is thus the only current possibility to map entirely and regularly the seabed.
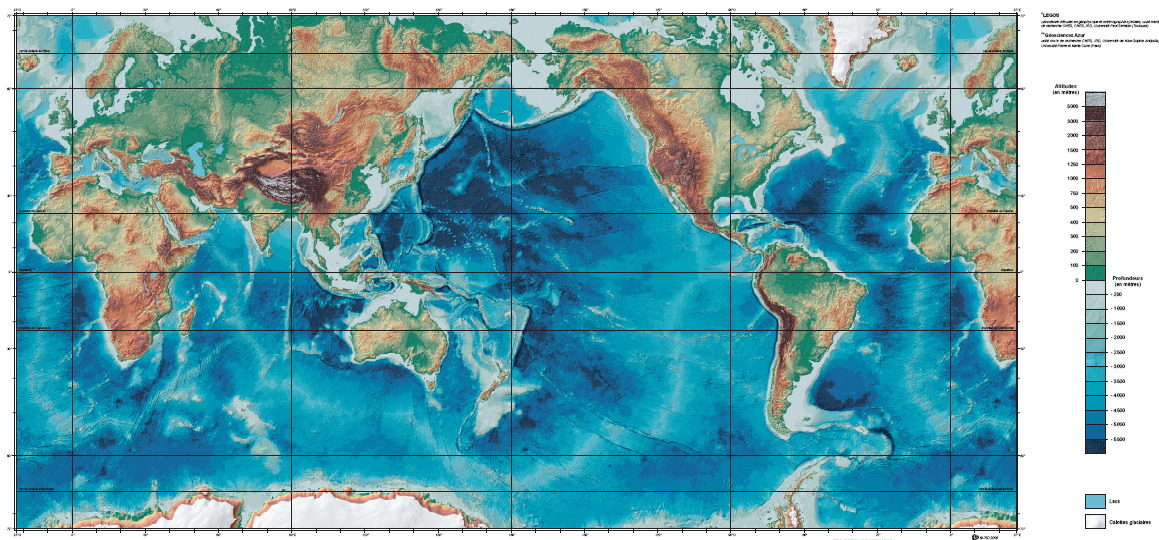
The seabed mapping is mainly an expression of the Earth's lithospheric plate tectonics and hotspots' volcanism.
In addition to the big structures of the tectonics (oceanic ridges, subduction and fracture zones), this topography is also shaped by:
- seabed thermal contraction when moving away from both sides of the ridge;
- lithosphere's deflexion under the effect of loads on its surface;
- sedimentation.
The hotspot volcanism is the main component with medium to short wavelengths (10 to 500 km) of the underwater relief. Only a regular and global coverage can properly map such huge and widely spread structures. So this relief's component is the least reproduced using oceanographic expeditions' data and is thus the greatest beneficiary of the global and regular coverage offered by satellite altimetry. The other processes have larger wavelengths and are properly reproduced by classical measurements.

The average sea level coincides with an equipotential surface of the Earth's gravity field: the geoid. Its geometry, with mounds and troughs with an amplitude of several tens meters, shows the lack of uniformity of the seabed and the planet.
The seabed topography shows density contrasts the signatures of which are clearly visible on the geoid. For example, an underwater volcano produces ripples on the geoid in the range of some meters with a geographic extension from a few dozens to hundreds kilometres.
The satellite-borne radar altimeters measure the distance between the satellite and the sea surface, instantaneously. Since the satellite's path is determined by orbital monitoring, we obtain the instantaneous sea's height above a reference surface simply comparing those two measurements. This instantaneous heigh differs from the sea average level because of the met-ocean phenomena (currents, constant circulation, reaction to atmospheric pressure variations, etc.) and tides.
Since 1975, two types of altimetric missions coexisted:
- oceanographic missions which give priority to repetitiveness over space coverage;
- geodesic missions which provide a dense coverage to the detriment of temporal repetitiveness.
The 18-month geodesic mission of the US GEOSAT satellite in 1986 was in the regard amazing: at the end of its cycle, the satellite had covered the whole oceanic field with less than 10 km between the tracks.
Then another similar geodesic mission was performed by the ESA's ERS-1 satellite in 1995 and reduced the average measurements' interval to less than 5 km.
The GEOSAT data were initially classified by the US Navy. Making the ESA's ERS-1 data freely available triggered the GEOSAT data declassification. The combination of both missions made the seabed mapping by altimetry possible with an amazing ground resolution.
The bathymetric calculation using sea heights is done by reversing the law of gravity, matching a mass anomaly - i.e. a relief - with the geoid's short-ripples. Two methods were developed:
- the spectral method of Sandwell and Smith (1994) offers a huge benefit being simple to implement and quick for calculations;
- the direct reversal method, developed by the authors (Calmant and Al. 2001) is much heavier but offers the benefit allowing a bathymetric calculation which directly incorporates the altimetric measurements and oceanographic expeditions' measurements and including estimates of uncertainty around the given bathymetry.

The satellite global seabed maps allowed a spectacular advance in the knowledge of the underwater relief. Thousands of small underwater structures, rifts, volcanic cones, fracture zones were identified thanks to those maps. Those maps are part of the more used remote sensing products around the world, afterwards proof of need. They are also among the less expensive products because none of the satellite missions was initially launched for this purpose. The current resolution is 5 to 10 km.
Greater progress in this field should result from a new CNES/NASA mission, SWOT. The bathymetric maps' resolution could improve to 2-3 km thanks to the radar interferometry technique and the detection of smaller structures, ever growing in number.
Contacts
- Scientific contact: Stéphane Calmant from LEGOS (Laboratory for Space Studies in Geophysics and Oceanography)
- CNES' solid Earth program scientist: Mioara Mandea